Unlock career success as a new MLIS graduate with tips on building in-person connections, honing key skills, and seizing opportunities for growth and advancement.
Collecting and using data productively in a time of COVID-19
It’s been a difficult year so far—and I’m sure many of us would like to just skip ahead to the moment when we have access to a vaccine and can launch a safe and complete reopening of our libraries. Since these events don’t appear possible just yet, many of us are focusing on a range of topics that were not previously “top of mind”. As a result, issues like personal protective equipment (PPEs), virus stability on books and social distancing now come up in many work-related conversations. Data may not be coming up in library-related conversations very often at present, but perhaps it should. By collecting and using data productively in this “time of COVID-19”, we will be able to both improve and showcase our services.
Here are some important reasons why we need to think about how to collect and use services-related data:
- Libraries, and in particular public libraries, are often thought of by the public as primarily physical spaces. However, during this pandemic, library staff are rising to the challenge of supporting the community through an increased digital presence and a showcasing of long-standing digital spaces. This is the perfect time to show the scope of our digital range to our community and our stakeholders.
- Many of us are trying a lot of new virtual initiatives during the pandemic. Tracking the data related to these initiatives will allow us to decide whether or not we will continue these new services once the pandemic is over.
- As we start to reopen, data about how customers are using our services will be critical in helping us to understand what our community wants, and how community members are, or are not, changing their behaviours in regards to our regular services and spaces.
Although we may be seeing mostly problems right now, we can use data to shift our focus and instead look at opportunities for clearly demonstrating the public value of library services.
Visualization of positive results for stakeholders
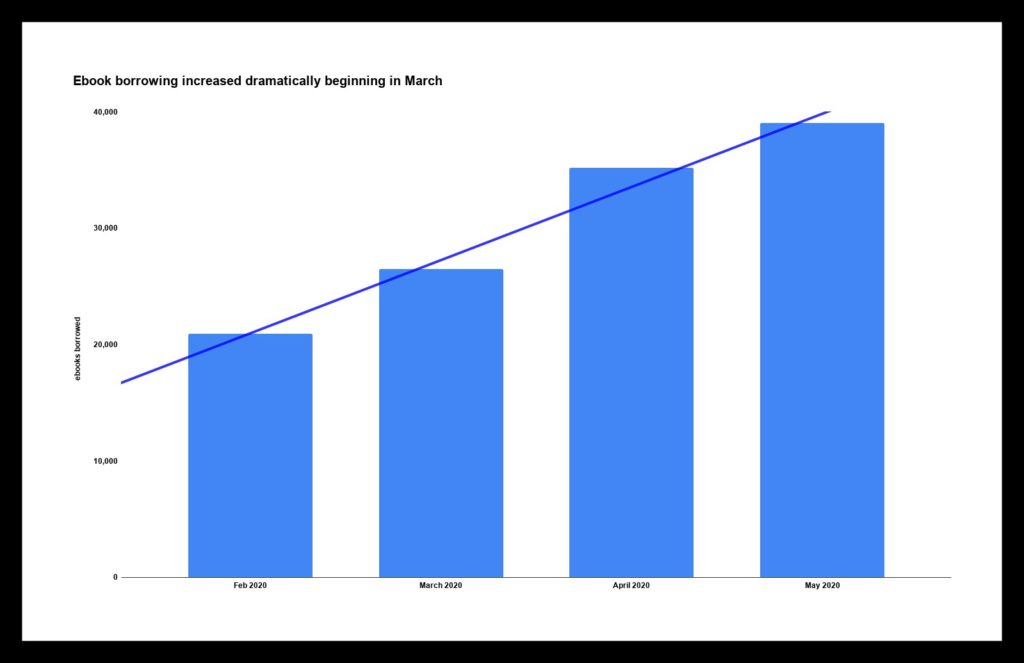
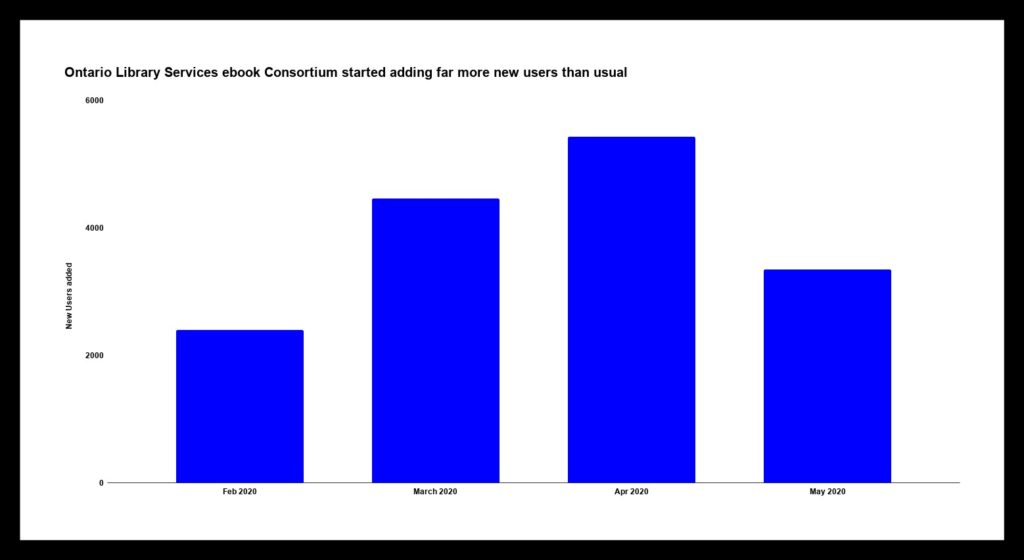
Your municipality/city probably has some kind of COVID dashboard during this time. If they haven’t already asked for your data, why not offer it to them? Instead of scary news about the spread of the virus, public libraries can show how many new customers are taking advantage of digital offerings. It’s a good news story for a change. Show a “before and after” snapshot of a given service—or a nice graph such as the following “data visualization” graph that demonstrates the increase in usage from February.
Other positive results that could be visualized include:
- increased social media interaction
- email/phone interactions between staff/customers (we may not be able to get together physically, but that doesn’t mean that staff aren’t interacting with customers)
- new “digital-only” customers acquired since the closures began
- increased usage of other digital services.
You could also decide to focus on a particular customer demographic or collection:
- an increase in use of children’s online resources
- an increase in the use of digital collections because your customers are looking for more resources on job searching and resume writing
- email and social media requests for information that customers are looking for most frequently.
All of these data points can be used to demonstrate to board members and municipal stakeholders the various ways in which public libraries continue to support the community even with branches closed.
A case for virtual programming
What kind of virtual programming are you doing: synchronous (live), asynchronous (pre-recorded) or both? Do you register participants or track the number of views? Are you able to do outcome-based surveys of your participants? Depending on what type of programming you’re doing and how your patrons are accessing the programs, you might want to choose one or two metrics to show the reach and/or growth of new virtual programming.
If you have introduced a brand new virtual program, maybe you want to show how many people have participated over time, just as you would for an in-person program. For example, if your library is now offering a virtual storytime, you can add the number of views ticking up every time a new storytime is added to the program.
Think about including survey questions as part of a virtual program. For example, Brampton Library started offering a weekly online trivia night for teens and adults. A couple of these questions are woven into each trivia set; sometimes these questions gauge awareness of online resources, and sometimes outcome-based questions are included to gather information about customer experiences.
Collecting metrics on your new virtual programs will help you to determine whether or not these new initiatives are worth keeping in the long-term.
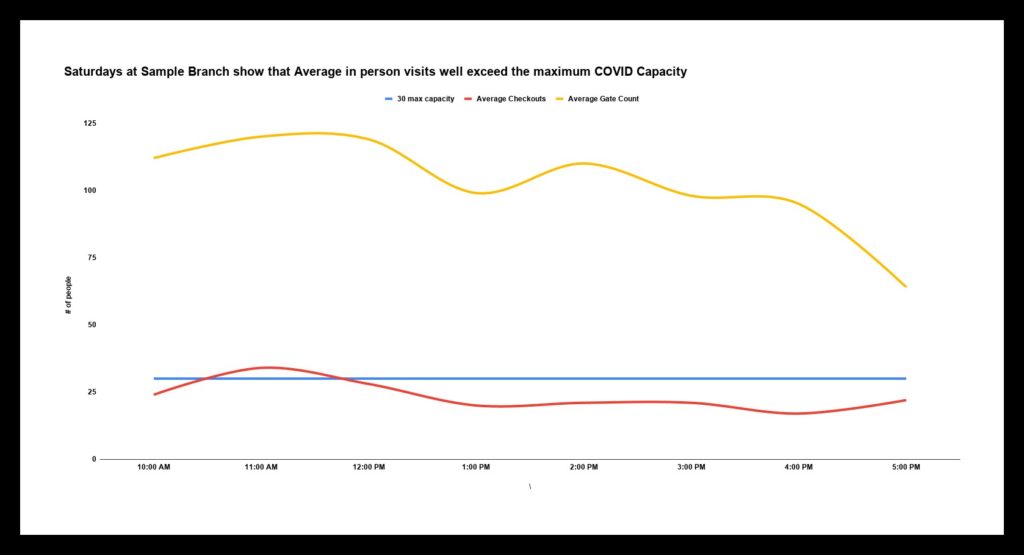
Better understanding customer behaviours
One topic that everyone is currently discussing is reopening capacity. Data can be used to understand usual customer behaviour patterns. Branch staff will definitely be able to identify the regular busy times by day and/or hour, but in addition, data could be generated to model capacity. There are a couple of different ways that data could be used to see these customer patterns:
- Customer checkouts in branch. Try pulling checkout data by day and/or hour from your integrated library system (ILS) to determine how many customers are physically in the branch checking out items during a given time period. A sample of four different weeks during pre-pandemic times can be used to average the results and create a graph of usual customer checkout patterns.
- Gate count. If your library has a gate count system that tracks the number of people coming in by hour of the day, then it is also be possible to pull some pre-pandemic data to create a graph showing usual visiting patterns.
When customers start coming back to the branches access to this data will make it possible to compare the new data and infer if people are trying to resume old patterns, or if their behaviour has shifted. A significant shift in behaviour may have an effect on the hours that a library is open, and on other administrative decisions such as crowd control and staffing needs.
Data for “the win”: One final tip
Data can be used in a variety of ways to support evidence-based decision making. Here is one final tip for thinking about how data can be used to demonstrate the value that public library services and programs add to communities.
There is no need to overthink data usage or to pull absolutely everything. Just pick a couple of key metrics that can be used to demonstrate and visualize positive stories about the experiences that patrons are having with library resources and then share with everyone!
As the chair of the Ontario Public Library Association (OPLA) Research & Evaluation Committee, I work with other volunteers such as Erika Heesen. Erika is the CEO and chief librarian of the Perth-Union Library. Here we are in conversation about the importance (and fun) of library data.
Alison Clarke and Erika Heesen talk data: Transcript (pdf)
Alison Clarke is the Coordinator, Performance Measures & Data, at Brampton Library. Alison designs data collection systems, and is currently working on modelling branch capacity. She also finds joy in showing people how to use a pivot table. Alison chairs the OPLA Research & Evaluation Committee and has discovered other data-loving colleagues through this volunteer position.
Related Posts